Strut Bar Design for Nissan Micra K13.
Front strut tower bar designed and FEA-validated for a Nissan Micra K13: free-body analysis, mesh-converged simulation, fatigue critique.
- Year
- 2021
- Role
- Mechanical Designer
- Domain
- Mechanical

What it does
This project designs and validates a front strut tower bar for a Nissan Micra K13. The strut bar ties the two front shock towers together so that the loads imposed during cornering are shared between them, which sharpens the steering response, reduces body roll and improves the feel of the vehicle on a winding road. The mechanical element analysed here is the front stabilizer bar — also called a strut tower bar in the literature — and its primary function is to stiffen the shock towers of a vehicle with MacPherson strut suspension by completely restricting the relative motion between them. The deliverable is the bar geometry — sized to fit between the towers and the engine — together with the chain of analyses needed to defend the design: a free-body analysis of the cornering loads, a SolidWorks finite-element campaign that converges the mesh, and a fatigue critique that takes the safety factor into account. The project also delivers an explicit recommendation for a follow-up revision, since the analysis surfaces a fatigue concern that a single static study would have missed — and that recommendation is part of the engineering deliverable, not an afterthought.
How it’s structured
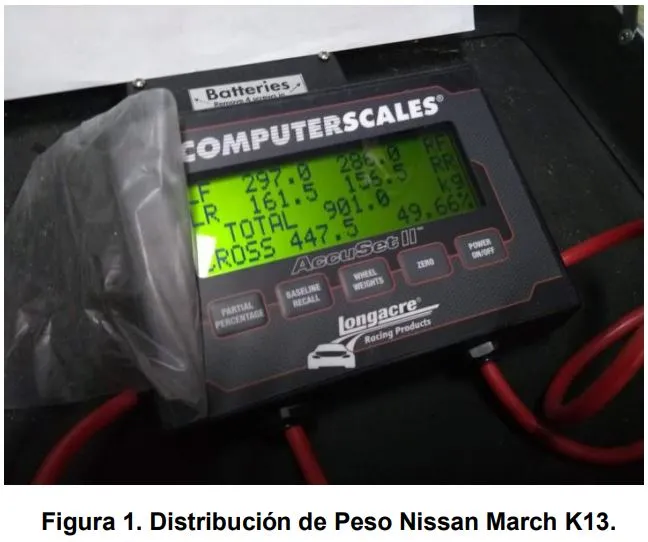
Inputs to the design were captured up front: a 901 kg kerb mass, a 90 kg driver, and a 65/35 weight distribution measured by weighing the vehicle on four scales (one per tire) under controlled conditions. The Nissan March K13 is a front-engine, front-wheel-drive hatchback, which is what drives the front-heavy weight bias and which determines the cornering load case the bar has to resist.
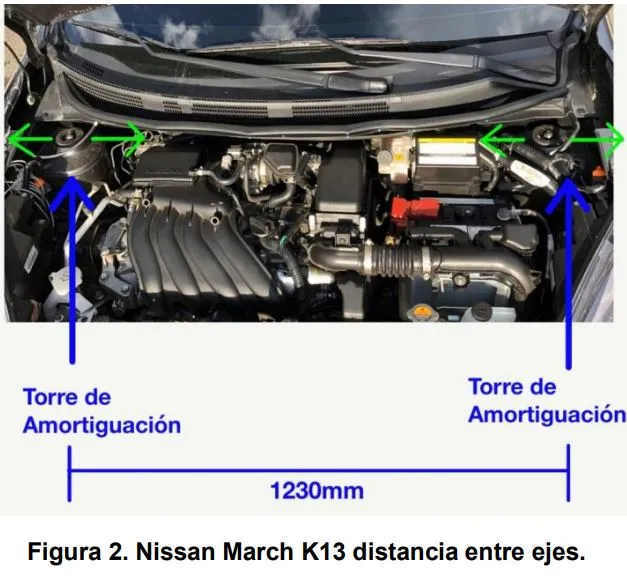
The available volume in the engine bay was photographed and dimensioned so that the bar had to clear the engine components — specifically, the bar had to rise to 65 mm above the attachment plane within 150 mm of the tower bolts to avoid interference with the engine. Suspension towers were highlighted with blue arrows on the engine-bay reference image, and green arrows indicated the direction of the displacements that the towers undergo under high-performance cornering — the very motion the strut bar is designed to suppress.
The bar itself is built from a 1-inch diameter, 1.9 mm wall mechanical pipe in 1020 steel, sourced from Ferroindustrial — a local supplier in Medellín whose 1020 product was characterised in previous EAFIT University projects (elastic modulus 200 GPa, yield strength 240 MPa). Around that geometry sits a chain of analyses: a free-body diagram for the cornering load case, a SolidWorks structural simulation, a 10-step mesh-convergence study, and a final review of safety factor and fatigue.
How it works
The cornering load case is derived from a free-body diagram. In vehicle dynamics, the FBD identifies the forces that cause tension and compression in the shock towers, and three force families dominate it:
- Lateral forces due to cornering, which cause the body roll that the stabilizer bar is designed to minimise.
- Vertical forces acting at the centre of gravity, which can affect the compression and tension in the shock towers.
- Reaction forces at the tires, which translate into the suspension system and feed back into the shock towers.
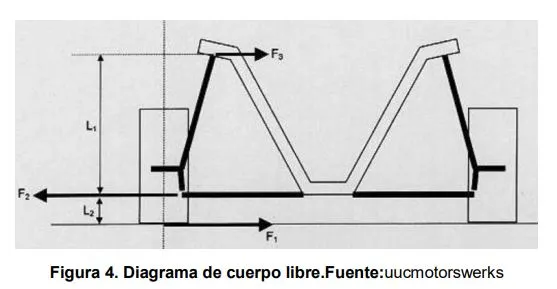
The relevant force on the strut tower — labelled F3 in the FBD — is what the strut bar has to resist. Sizing F3 is the decision that determines whether the simulation is useful at all, and the sizing follows the rule from Race Car Vehicle Dynamics: a street vehicle on semi-sport tires without chassis modifications corners at a maximum of 1 g. That assumption sets the maximum frictional force the tires can generate, which in turn caps the maximum lateral acceleration the chassis can develop and therefore the maximum F3 the strut bar will ever see in service. After performing the summation of moments around the relevant pivots, F3 lands at 1,446 N tension/compression at the bolted ends of the bar. This force is the load that drives every downstream simulation, and pinning it to a defensible source — the textbook 1 g cornering bound — is what makes the rest of the analysis credible during peer review. The bar’s design then has to deliver enough stiffness and rigidity to counteract these stresses while maintaining the integrity of the shock-tower position, so that the bar improves the vehicle’s handling and stability rather than simply moving the failure point somewhere else in the suspension system.
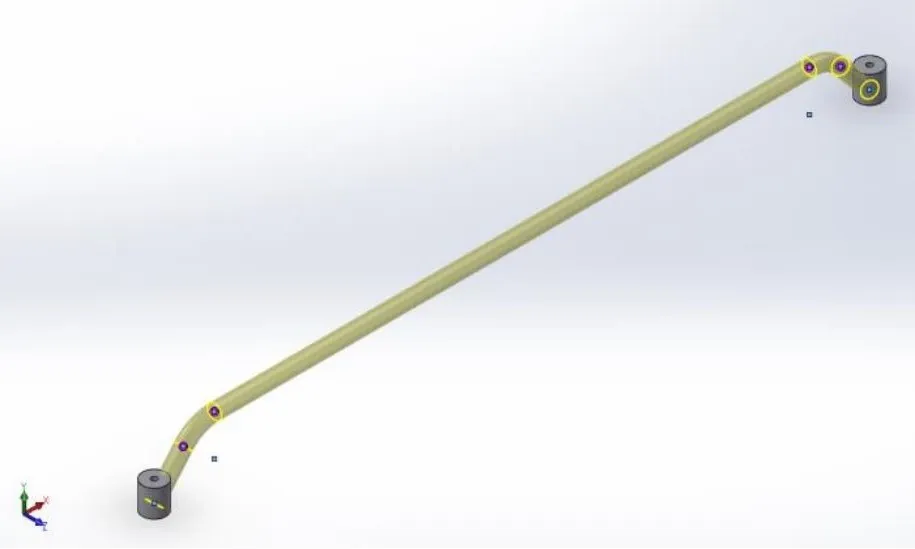
After F3 is fixed, the bar geometry is created in SolidWorks. The MMGS (Millimeter, Gram, Second) unit system was used for the entire model, and the construction method started from a 3D sketch and used the SolidWorks structural-member tool to generate the tube geometry along the sketch path. After several preliminary simulations, the most suitable exit angle of the bar to withstand the loads and meet the design requirements settled at 50 degrees — that is the angle at which the bar exits each tower mount before it transitions to the central span. The 50° angle is the geometric compromise that lets the bar clear the engine within the 65 mm / 150 mm clearance envelope while still presenting an axially loaded path between the two towers, so that the bar carries F3 in tension and compression rather than in bending.
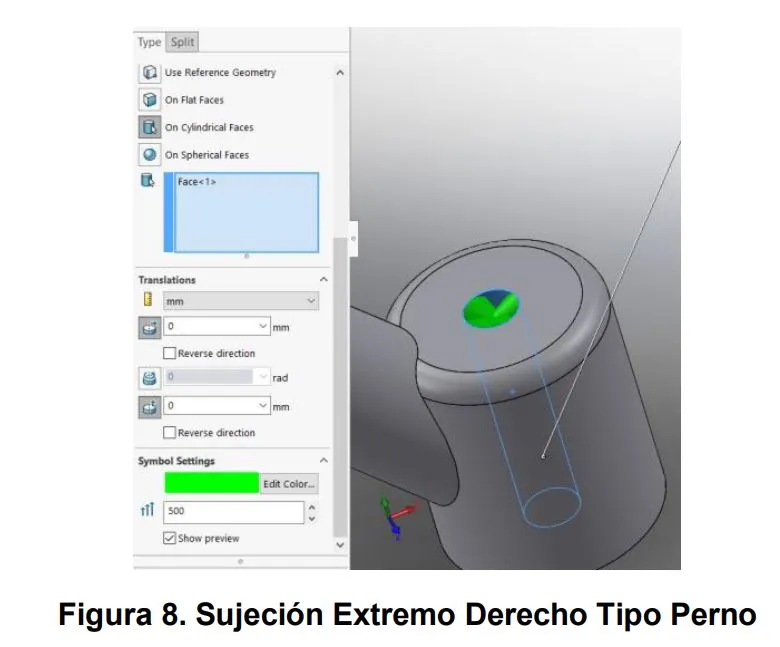
With the geometry fixed, the simulation is set up. The load conditions for the element — under tension and compression by F3 = 1,446 N — are applied first. The bar is fixed by two bolts, and through one of them the tensile or compressive stress is transmitted under specific cornering scenarios; for that reason the internal face where the bolt would land is restricted. A partition line is inserted on the internal face of the right-end element so that the load can be properly applied to the contact surface that actually carries it, rather than smearing it across the whole end face.
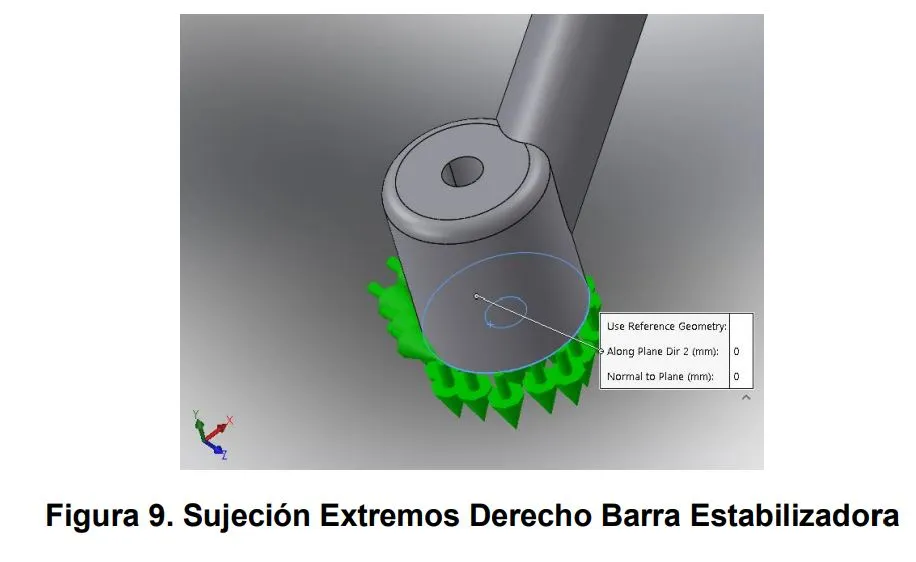
The lower face of the element carrying the load is restricted in two planes to ensure the simulation is parameterised correctly, and gravity is added with the value 9.81 m/s². These boundary-condition steps are what make the simulation reflect the real installation — fixing the bar at the bolt points and applying the load equivalent to F3 reveals whether the bar will perform as required, and the gravity factor closes out the natural-force envelope acting on the component.
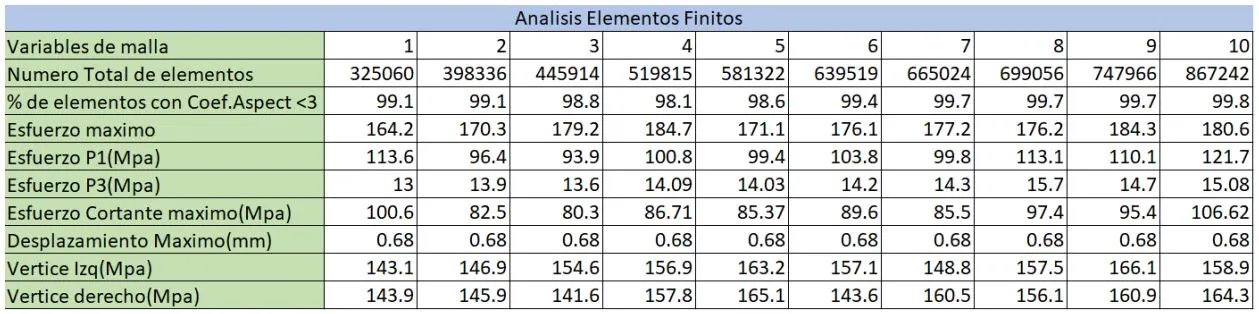
Material selection followed: a 1-inch diameter, 1.9 mm wall mechanical pipe from Ferroindustrial, in 1020 steel, was chosen because the same product was characterised in previous EAFIT University projects, where the elastic modulus came out at 200 GPa and the yield strength at 240 MPa. A custom material was created in SolidWorks by adjusting the default 1020 steel parameters with these characterised values, eliminating any uncertainty that would arise from defaulting to library values for a steel that the team had not measured. With the material locked in, 10 simulations were performed, each one decreasing the maximum element size by 0.05 mm starting from 1.8 mm, with the aim of evaluating mesh convergence by tracking how the displacement and the stress at two reference vertices behaved as the element count climbed.
The first thing the convergence study showed was that the results stay quite stable as the number of mesh elements increases, and that the mesh quality stays high throughout — which means the simulation results can be considered reliable and accurate. That stability is the precondition for any meaningful convergence plot, and the same stable behaviour was observed when running the previous tensile-only exercise as a sanity check.
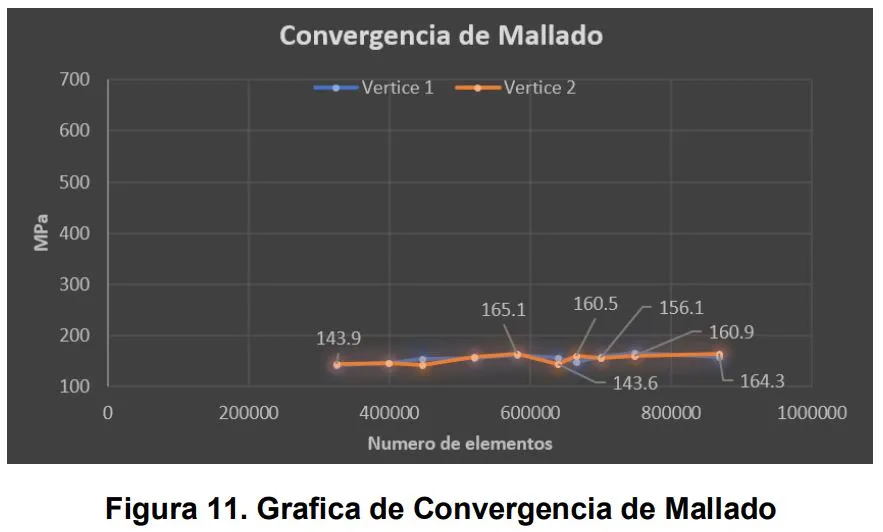
The mesh-convergence plot itself is built from the stress measurements at the two vertices identified in the geometry, with the stress logged at those points across all 10 cycles.
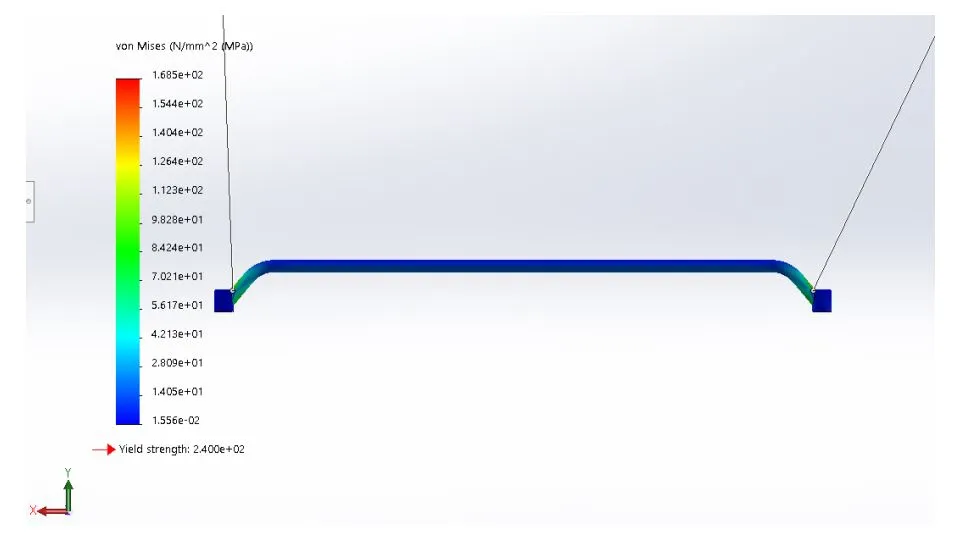
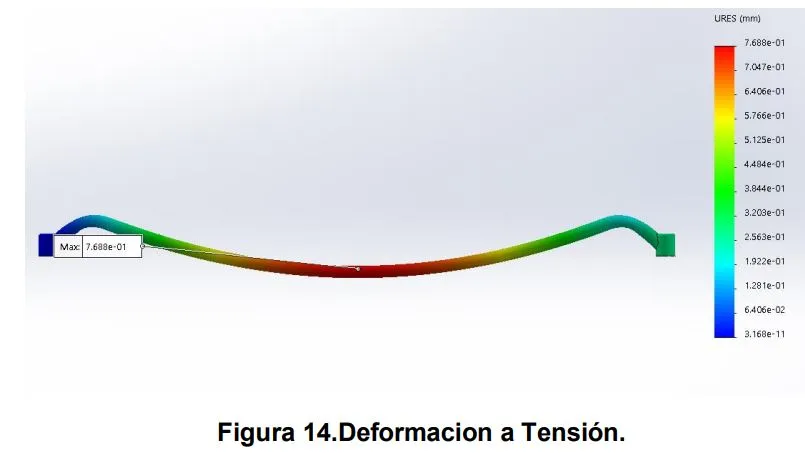
From the convergence plot the conclusion is clear: when 99 % of the mesh elements have an aspect ratio of less than 3, and the model has more than 350,000 elements, it exhibits reliable convergence. Past that element count the displacement and stress traces stop moving — there is no payoff for refining further. The peak displacement under the load case sits below 0.8 mm and meets the design requirement, and the deformation pattern under both tension and compression matches what would be expected physically.
What I learned
The most useful lesson was that mesh convergence is the right way to defend an FEA result: running ten simulations and watching stress, displacement and aspect ratio settle gave us a much stronger argument than any single high-resolution run, and the convergence plot itself became one of the more persuasive figures in the report. Choosing the SolidWorks structural-member tool — driven from a 3D sketch in MMGS units — to generate the bar from a single tube path also paid off, because every iteration on the 50° exit angle came back to a clean re-run of the same construction tree rather than a manual redraw. The free-body diagram was equally important — choosing the right load case from the cornering analysis is the decision that determines whether the simulation is useful at all, and grounding it in the Race Car Vehicle Dynamics approach for a 1 g street-tire cornering bound made the assumptions easy to defend during peer review. The 1,446 N value for F3 fell out of that bound by a moment summation, and once F3 was fixed every downstream choice — bar diameter, wall thickness, exit angle, bolt-face restraint — flowed from it cleanly.
The biggest engineering finding was that a safety factor very close to 1.0 is not acceptable for a part that lives inside a vehicle subject to repeated load cycles. Since the bar is installed in a vehicle that goes through many cornering, braking and pothole-induced load cycles over its service life, fatigue-related degradation that could lead to failure is a real possibility, even though every static study passes. This is a deliverable critique rather than a failure: the static analysis is sound, the methodology is defensible, and the conclusions hand the next revision a clear set of options to act on. The follow-up recommendation is to either move to a material with better mechanical properties (a higher-grade steel or a switch to chrome-moly) or revise the geometry (a thicker wall, a larger diameter, or a redistribution of the bar’s cross-section toward the regions of peak stress) so that the safety factor sits comfortably above 1 — well clear of the fatigue regime — for the intended service life.
Based on the results obtained through manual mesh refinement, the project closes with three explicit conclusions:
- The displacements of the model are not sensitive to mesh refinement — past the convergence threshold, refining further does not change the answer, which is exactly the property a converged FEA result should have.
- The stabilizer bar, despite withstanding operational loads, has a safety factor very close to 1.0, and because it is installed in a vehicle subject to many load cycles, fatigue-related degradation is a real failure mode that a single static study does not capture; this conclusion is framed as a deliverable critique that hands the next revision a clear path forward (better material or revised geometry).
- For the proper simulation of this component, having more than 350,000 elements is sufficient to reach a reliable and accurate model — beyond that count the simulation does not buy any additional precision, so future iterations should target that envelope as the floor and not waste solver time on finer meshes.